ENERGY ANALYTICS

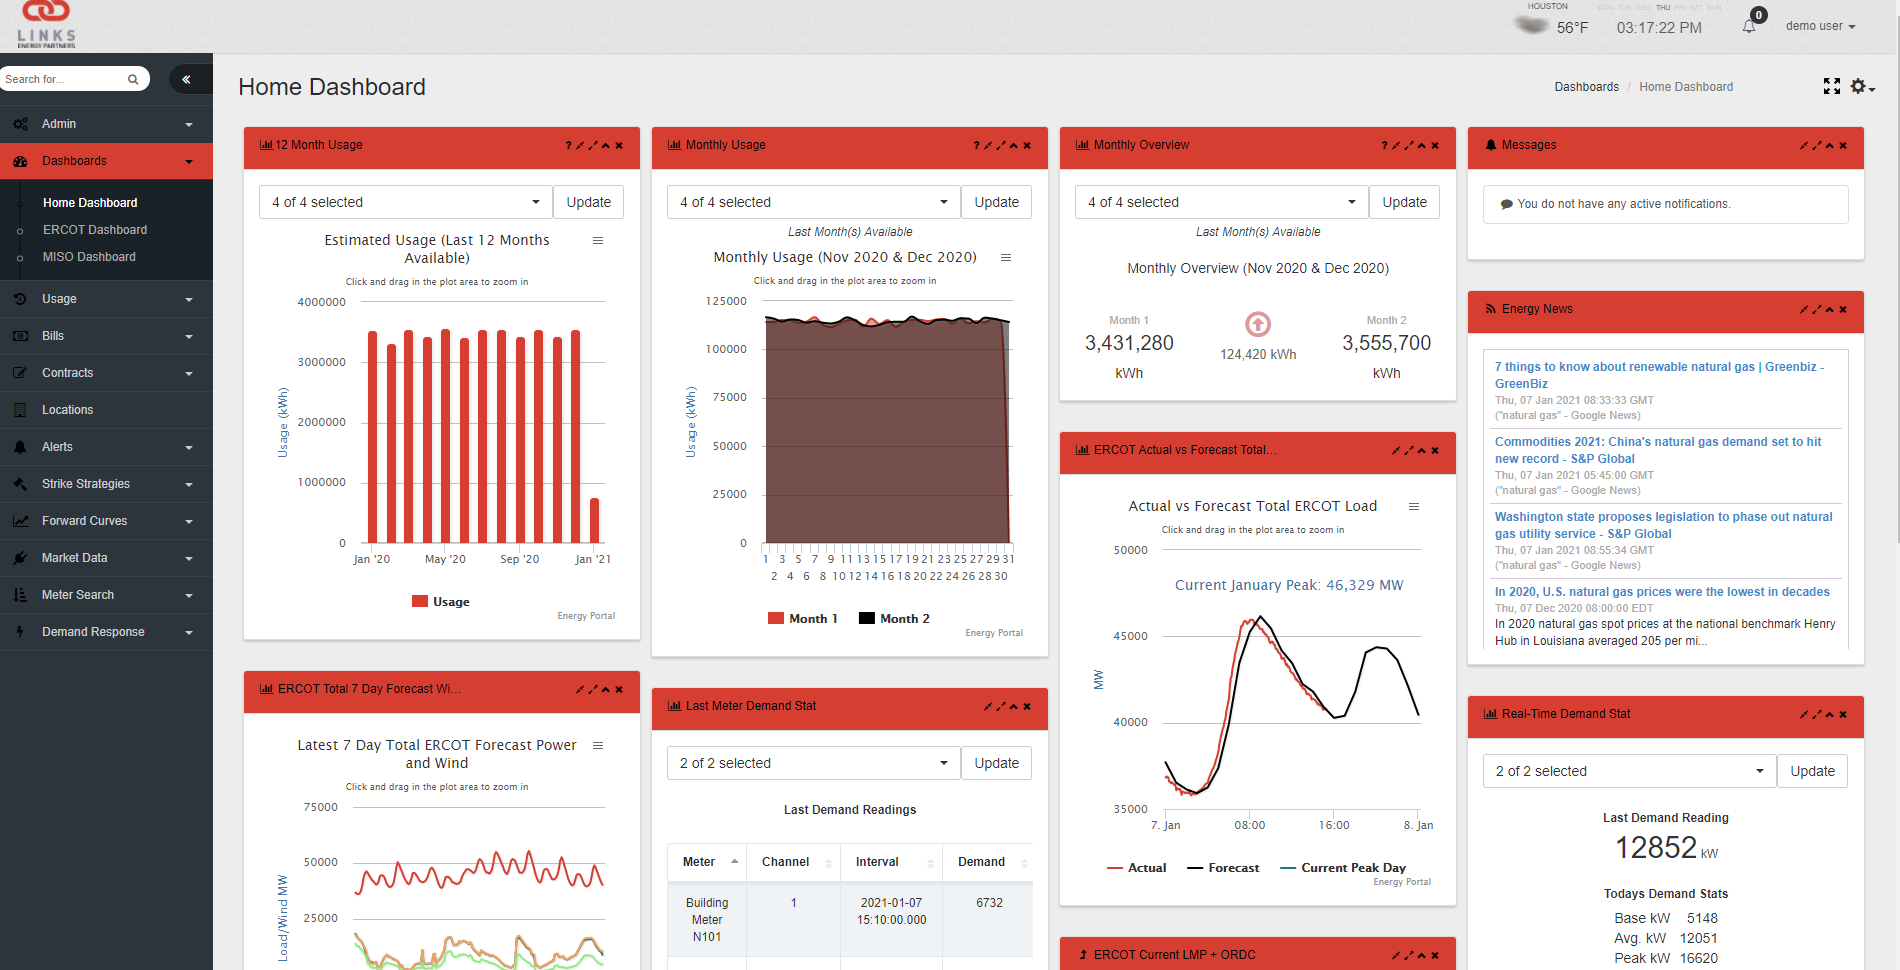
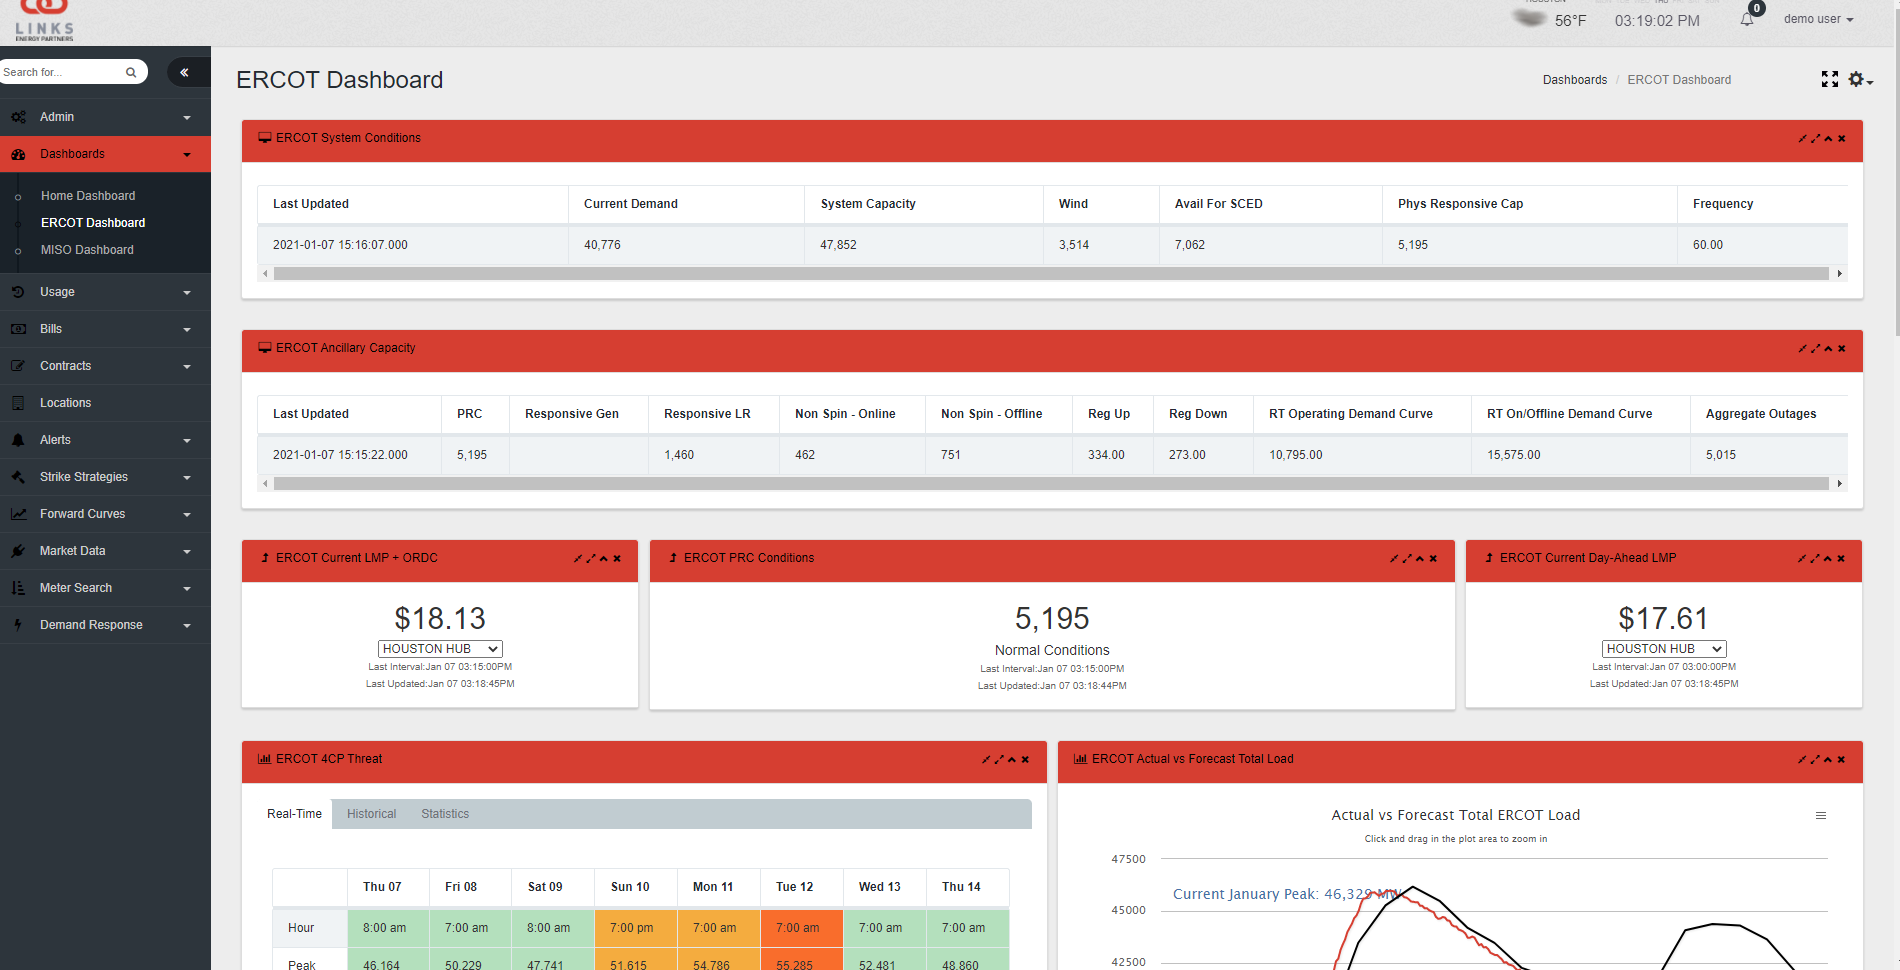
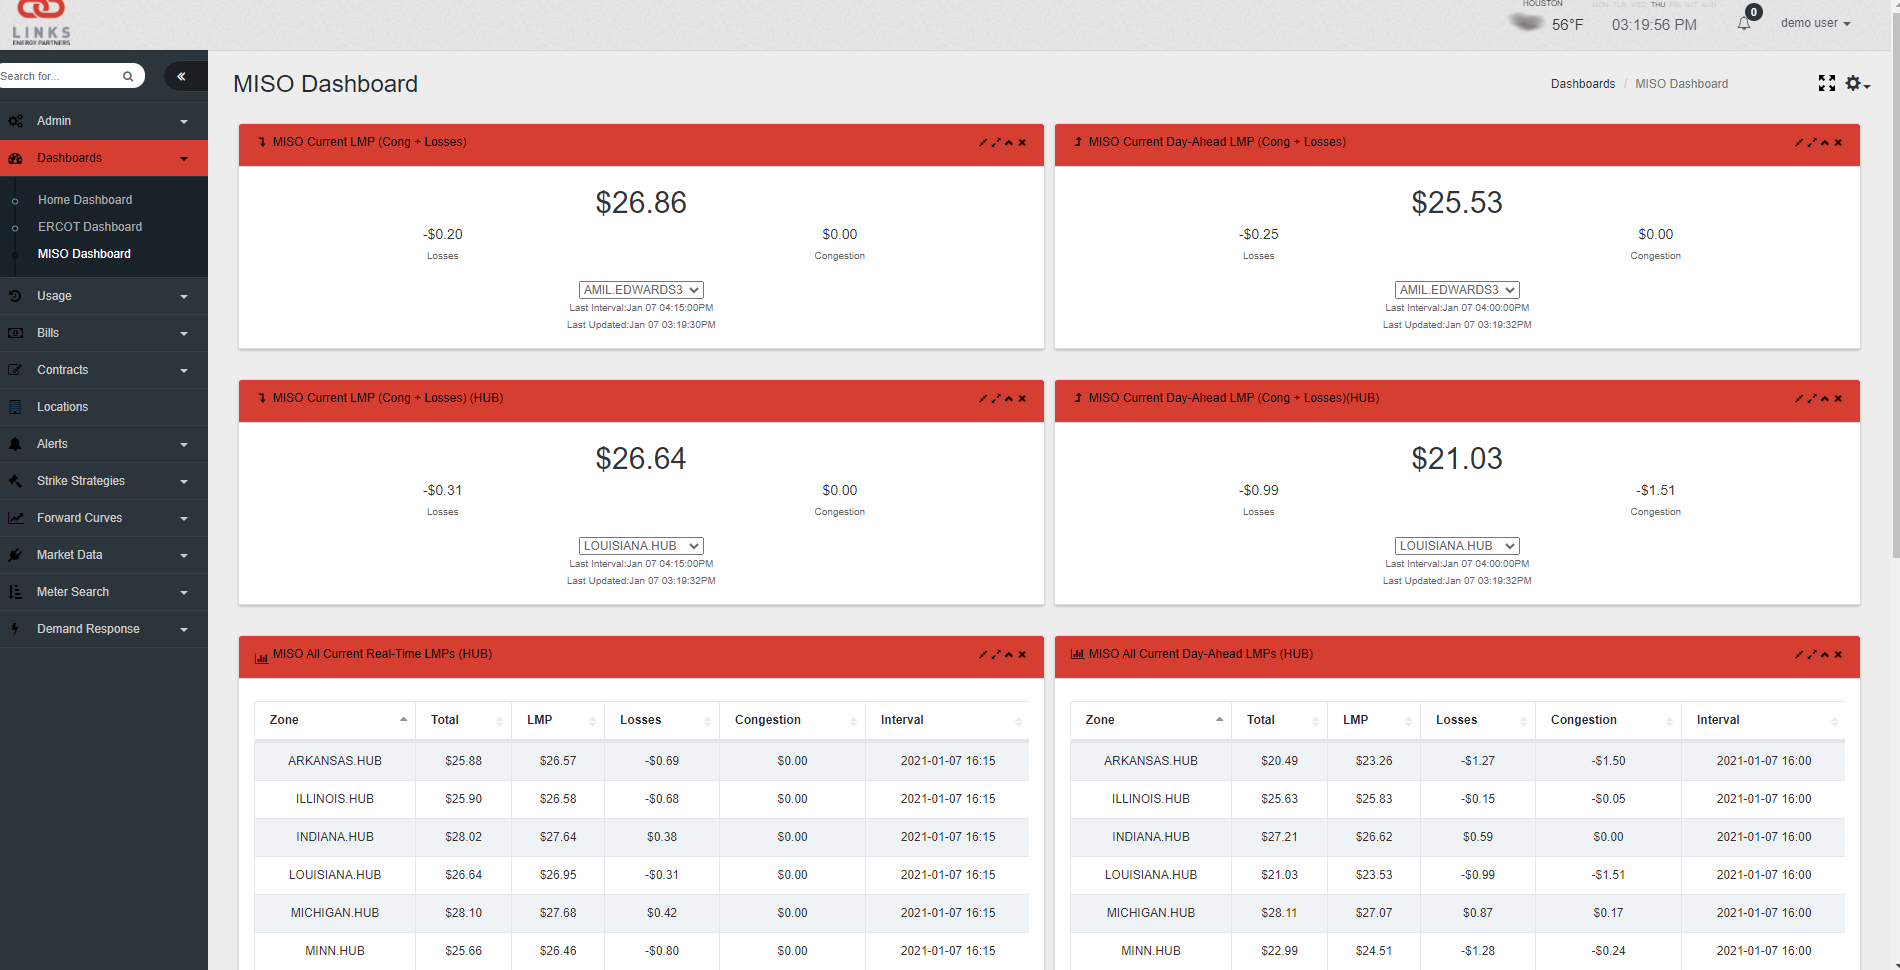
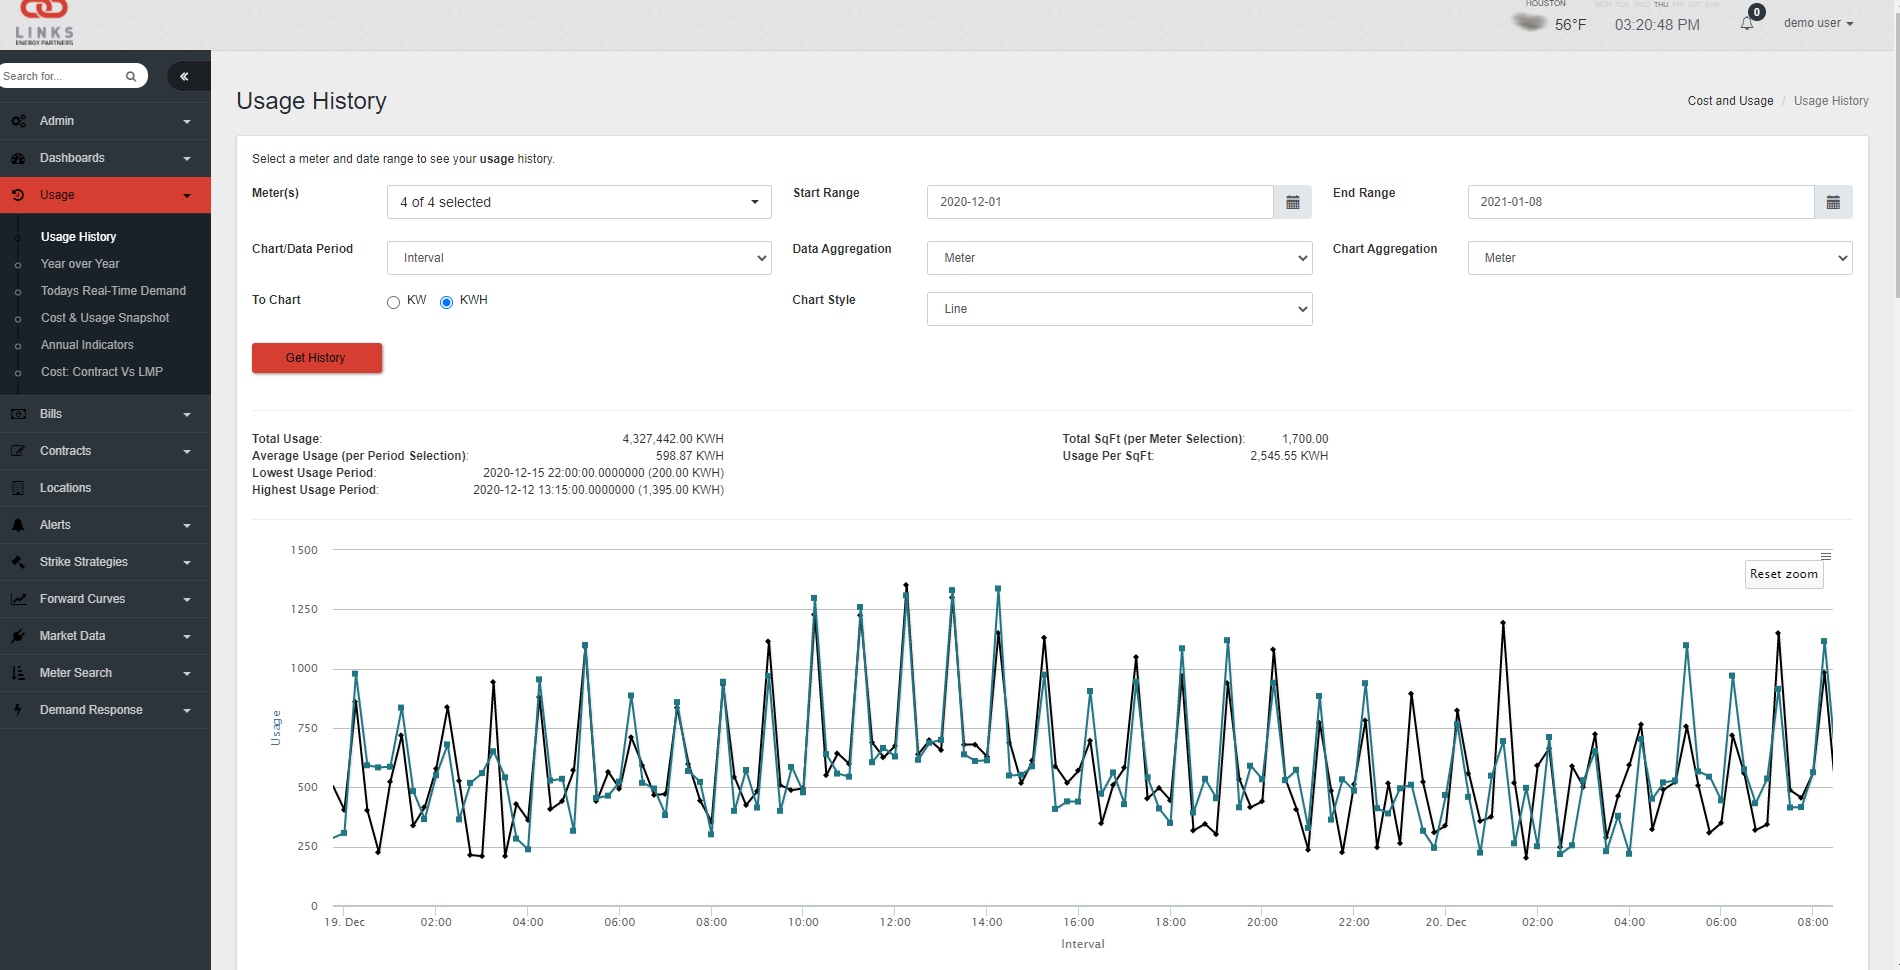
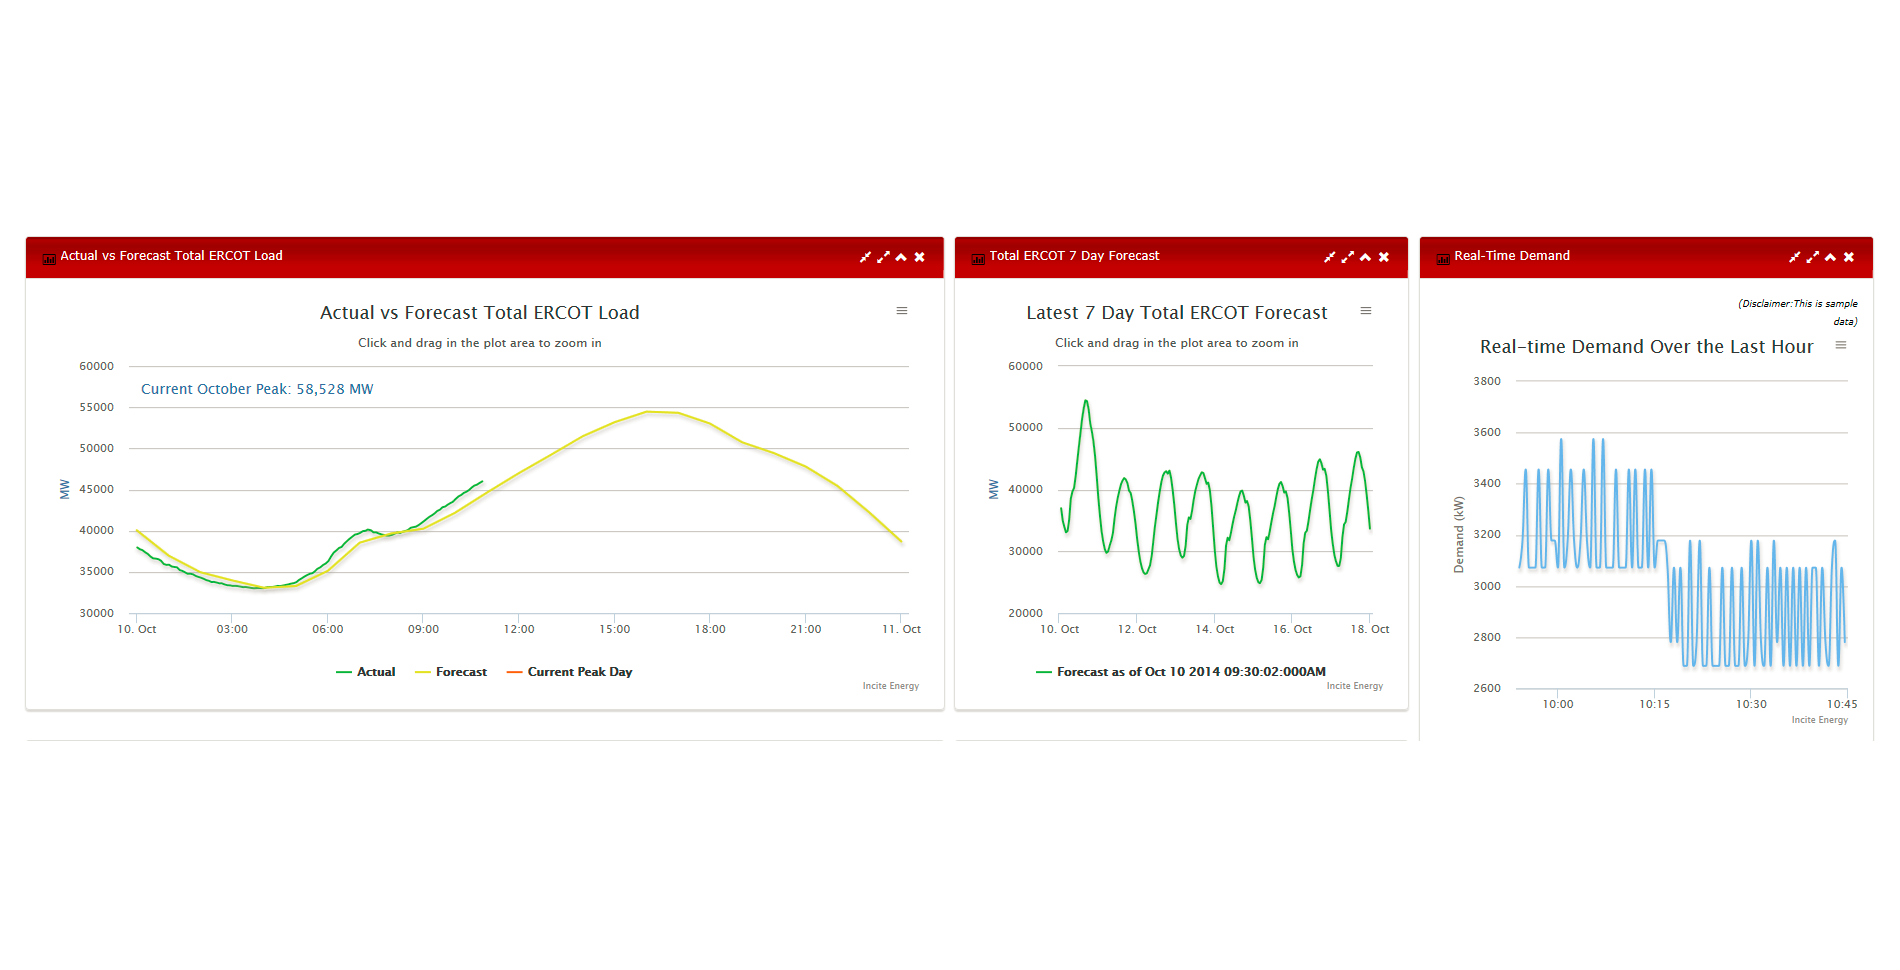
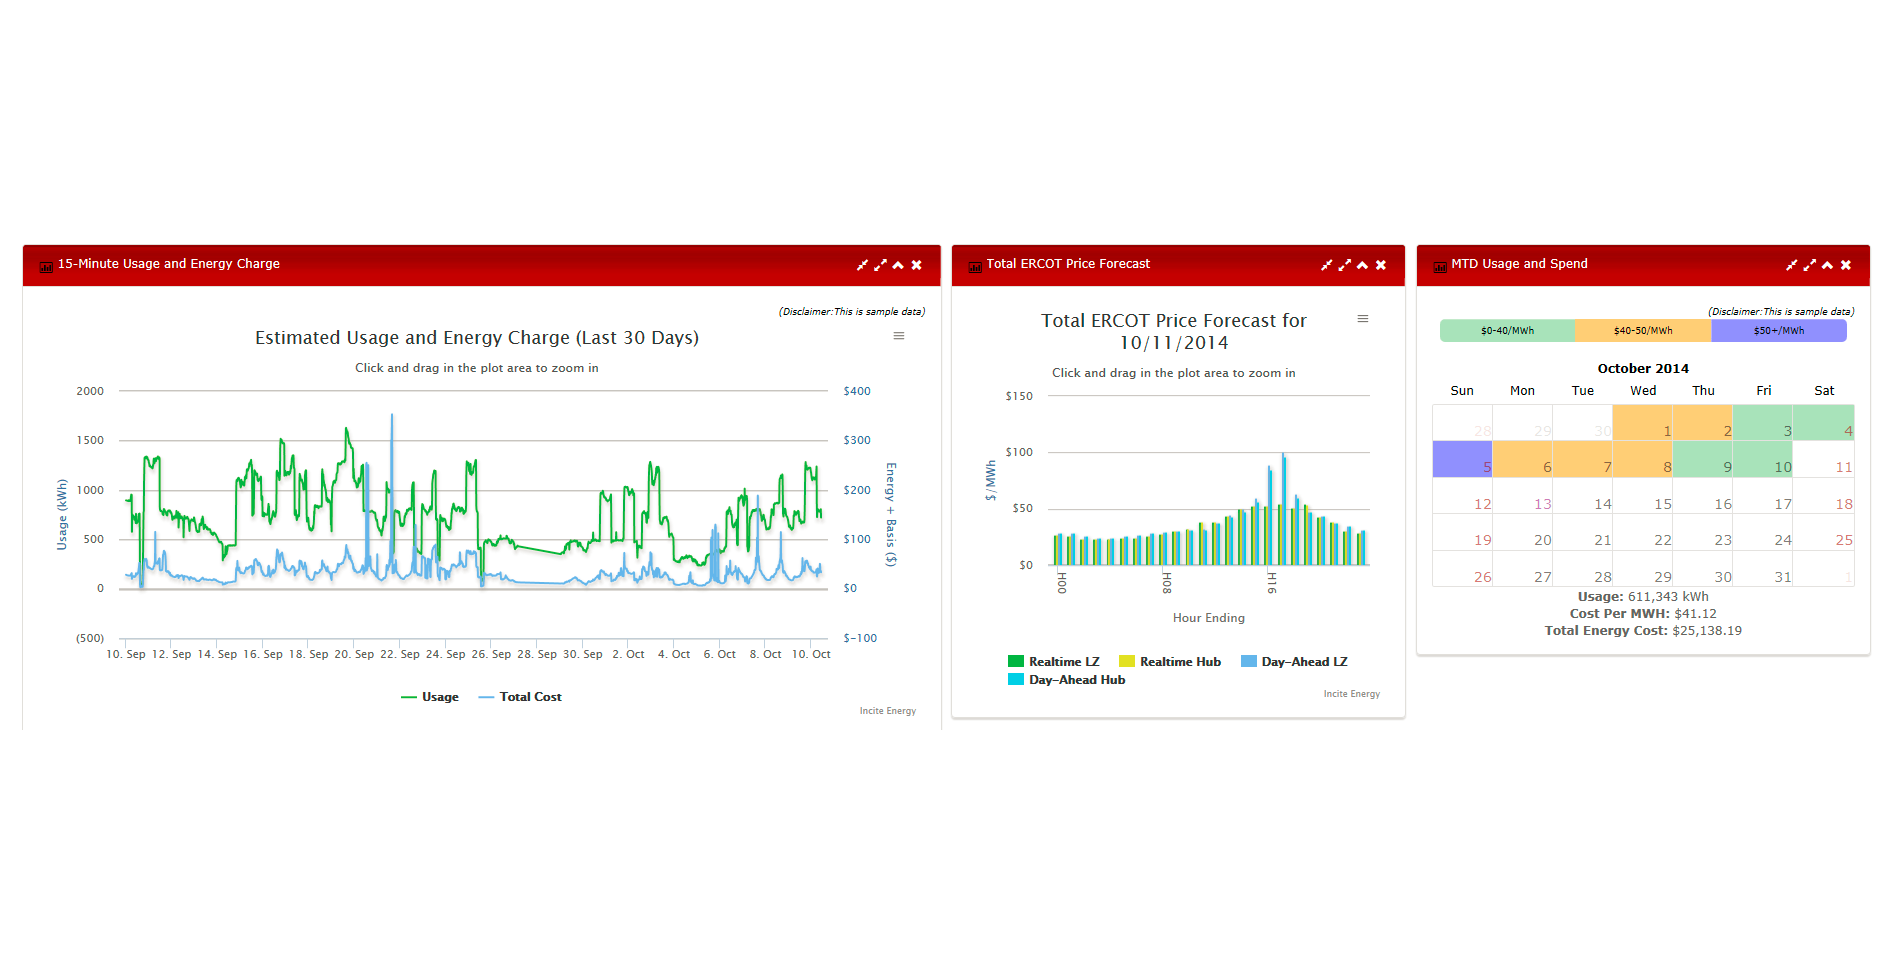
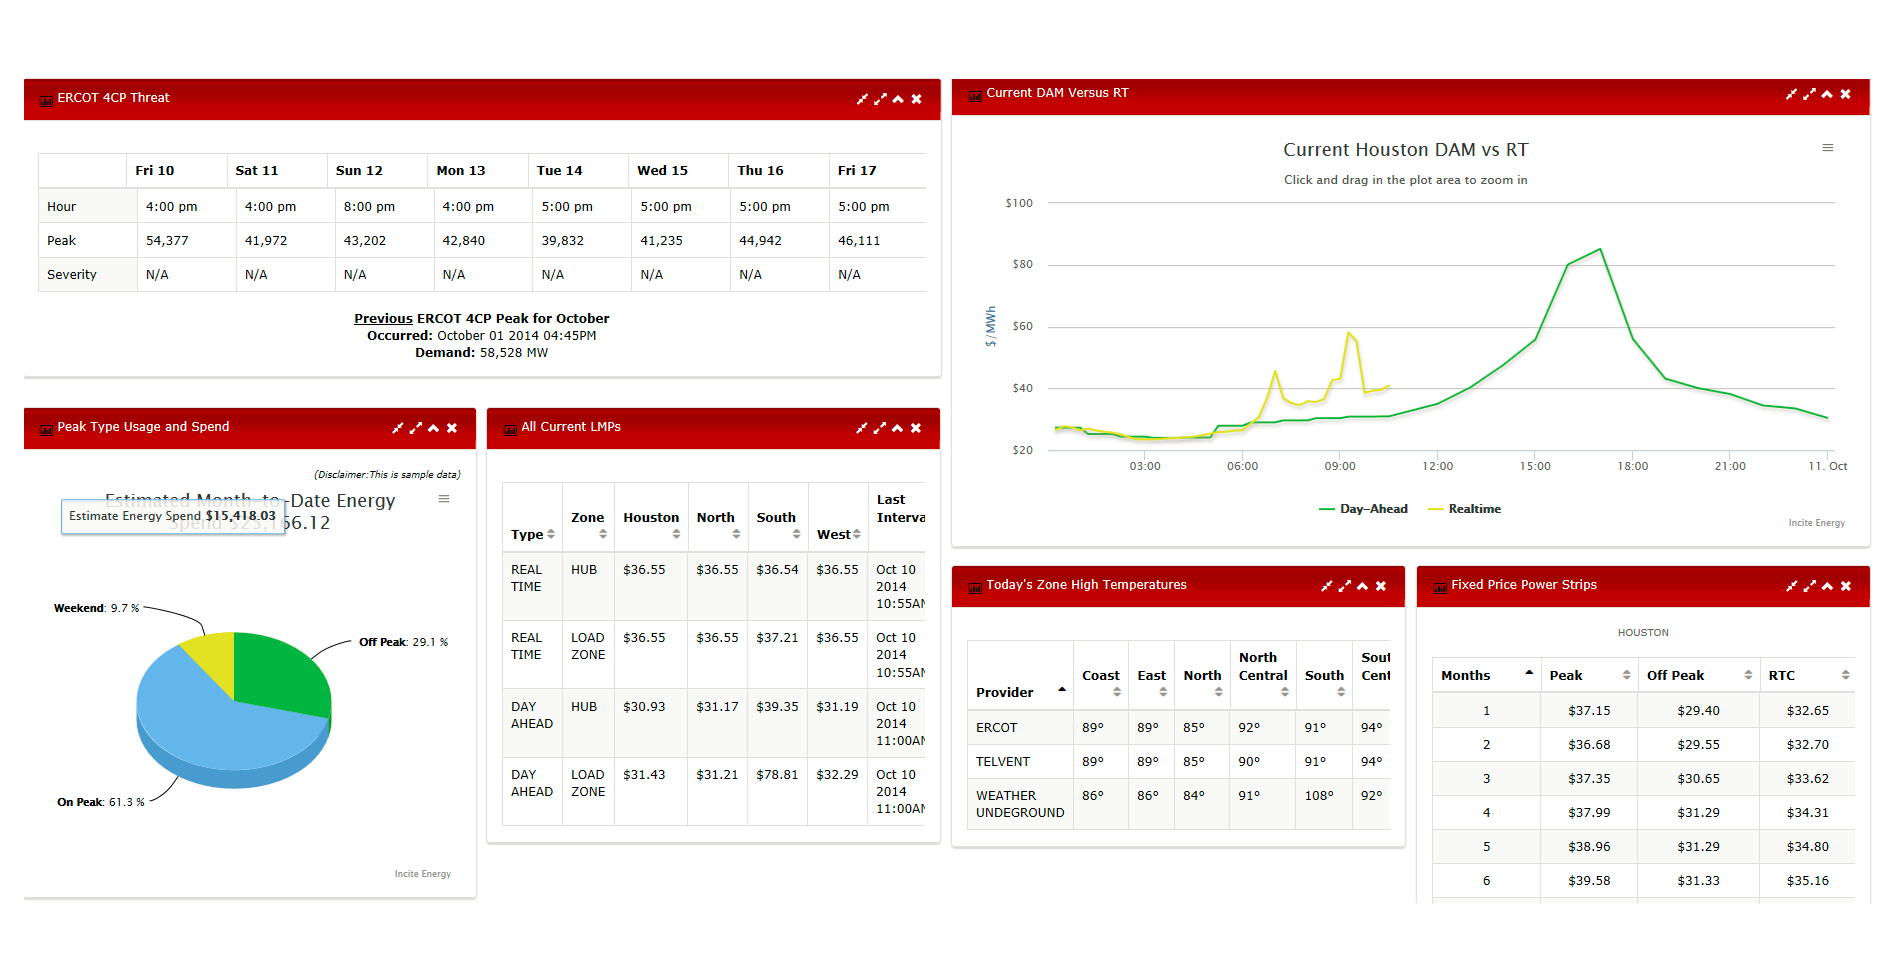
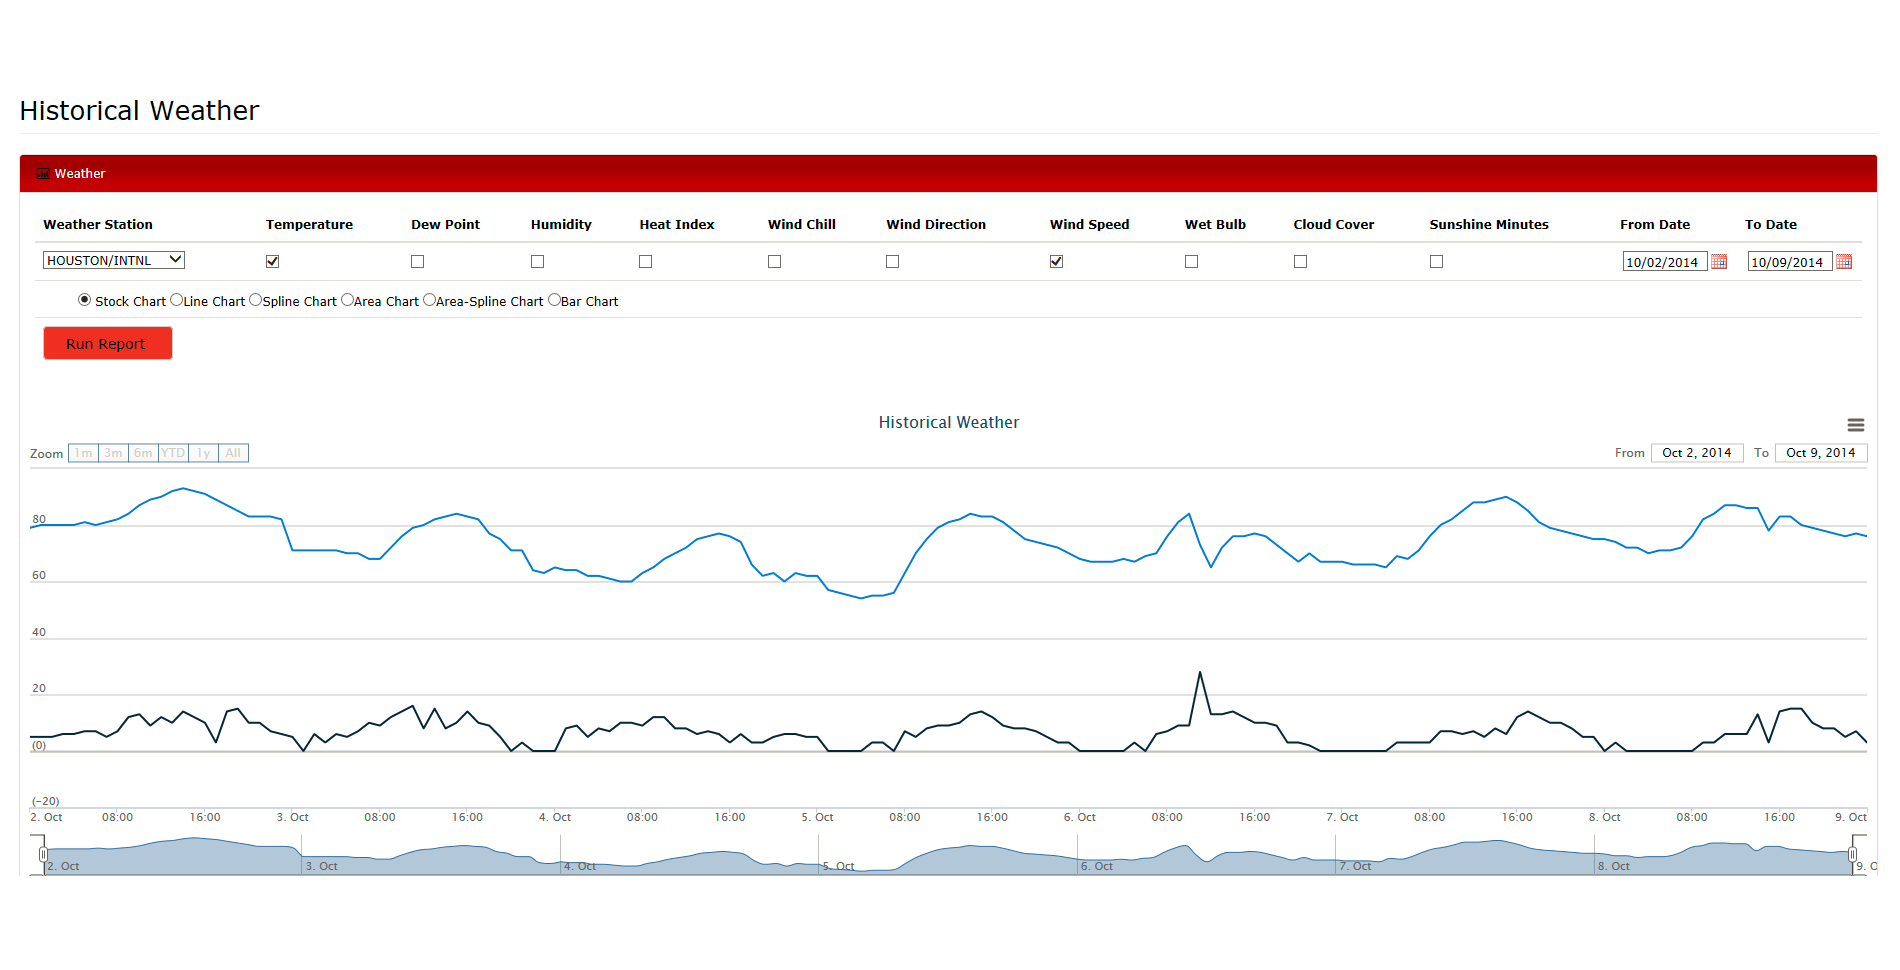
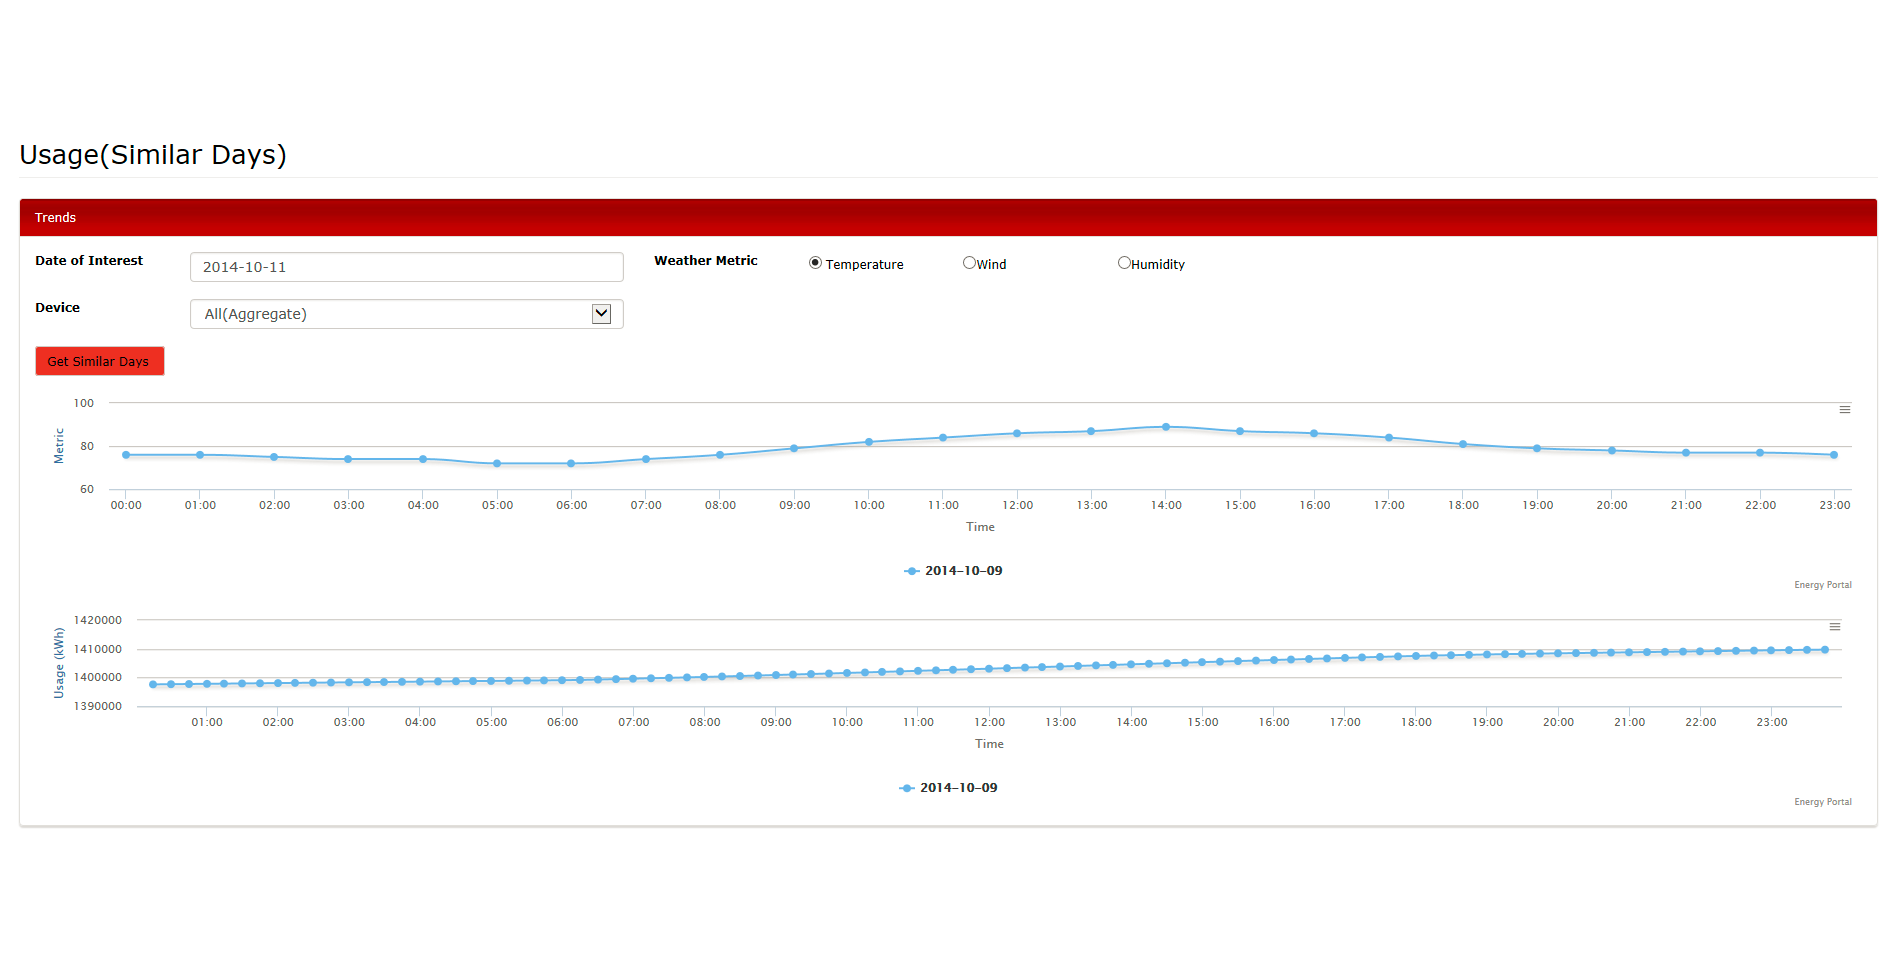
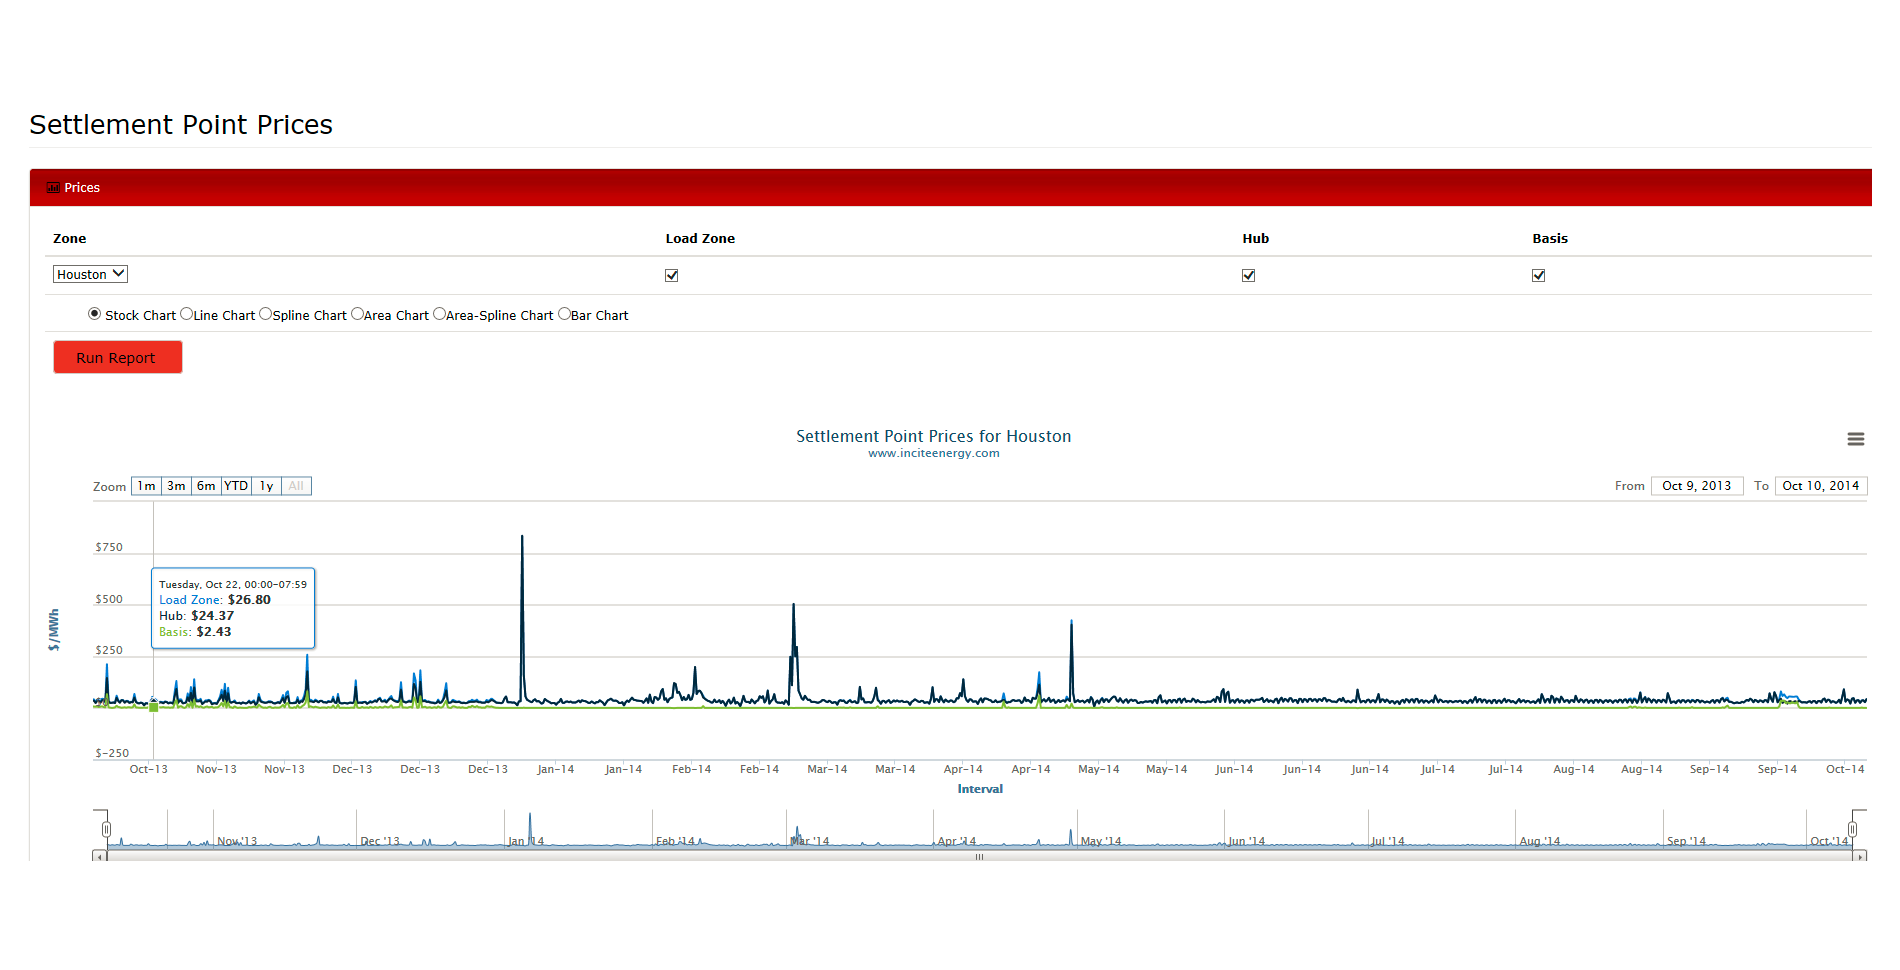
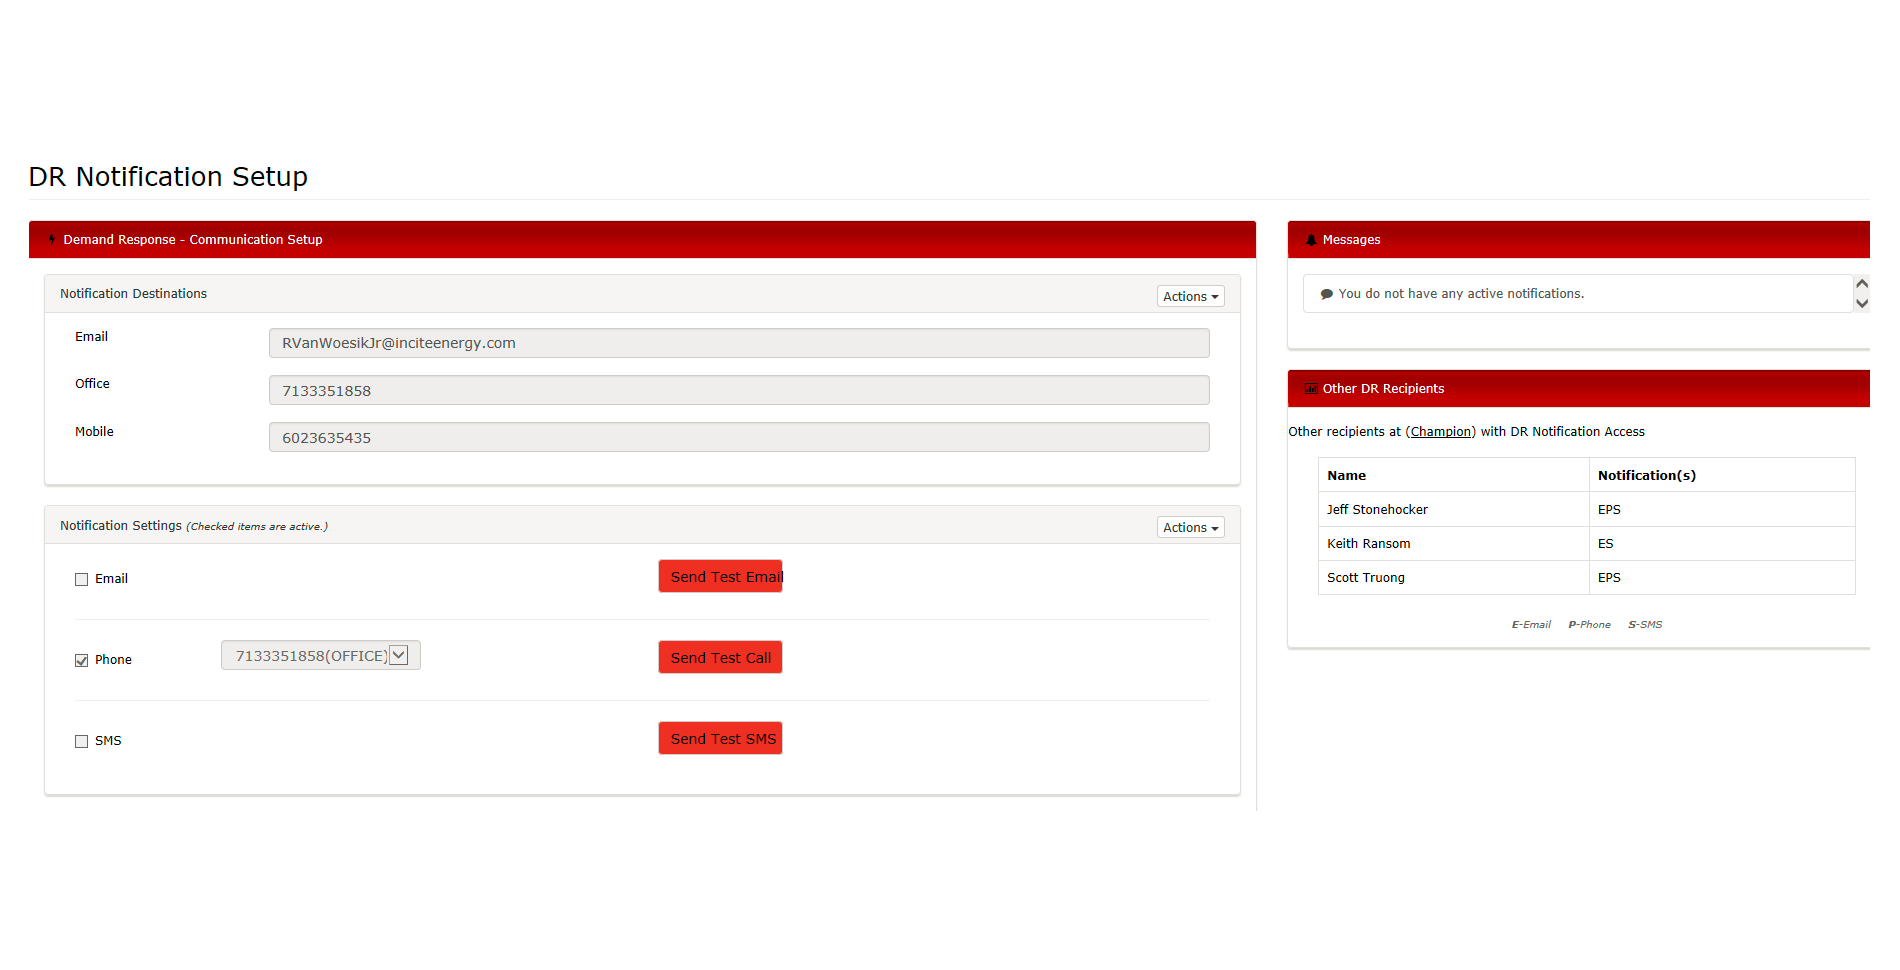
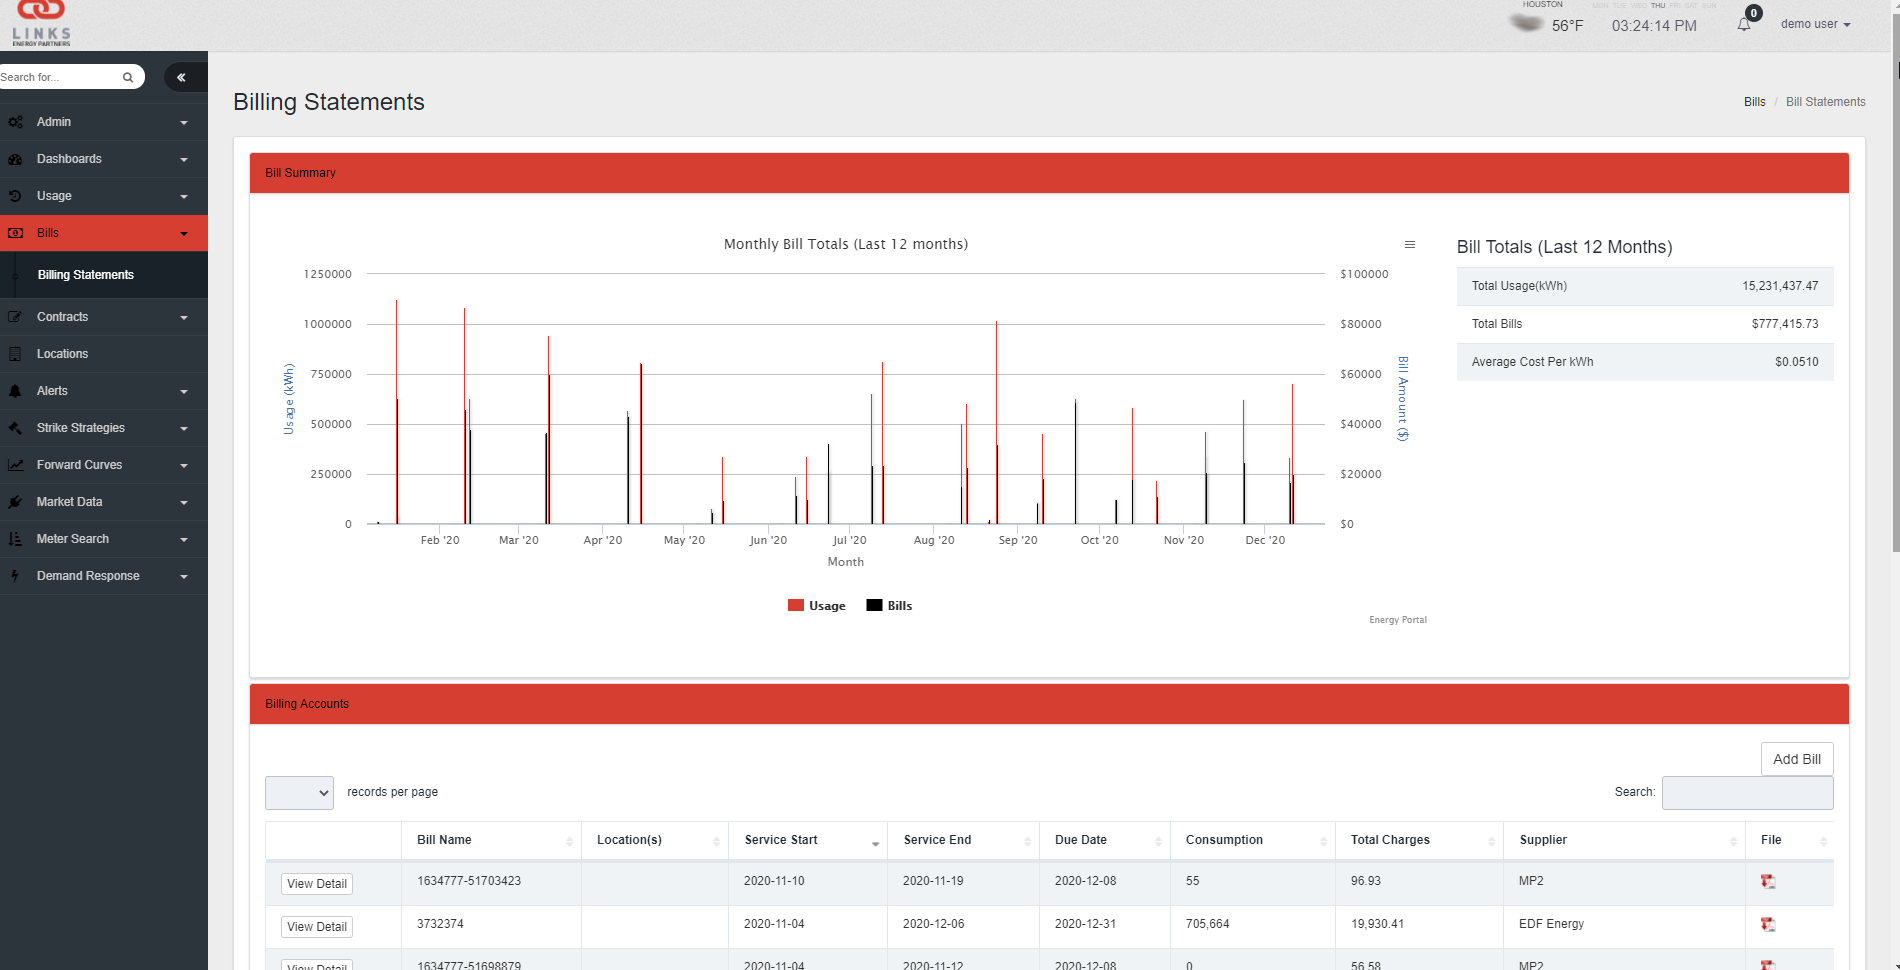
Developed by our in-house software and programming team, in collaboration with direct customer interaction, our comprehensive web-based utility portal, Energy Analytics, monitors your facility’s load and provides up-to-the-minute market intelligence that offers true insight allowing you to make decisions in real-time.  This technology is fully customizable and designed to meet each client’s unique customer locations, regions, commodity products and curves.

Home Dashboard

Home Dashboard

The Energy Dashboard can be customized to to display charts, graphs and tables that illustrate key data points.

ERCOT View

ERCOT View

Explore conditions by market including Current Demand, System Capacity, Current LMP, Day-ahead LMP, etc (ERCOT example shown).

MISO View

MISO View

View All Current Time LMPs and All Current Day-Ahead LMPs (HUB) by market (MISO example shown).

Usage History

Usage History

Energy usage can be shown in aggregate or by individual meters in 15 minute interval usage and energy charge.

Actual vs Forecast

Actual vs Forecast

View Actual vs Forecast for specific load zones in Real-Time Demand or in a 7-Day Forecast format

Aggregate or Single Meter

Aggregate or Single Meter

View 15-minute interval usage and energy charge, as well as Price Forecast by Market Regions; MTD Usage and Spend Calendar

Analytical Graphs

Analytical Graphs

4CP or 5CP Threat | Live DAM vs RT Price | Aggregate or Single Meter Usage/Spend | Market Zone High Temps | Fixed Price Power Strips

Historical Weather

Historical Weather

Show historical weather (by city) including temperature, dew point, heat index, wind chill/ speed/direction, cloud cover, sunshine minutes, and more

Cost and Usage

Cost and Usage

Access historical data for similar and like days based on weather, including metered usage details (temperature, wind and humidity).

Settlement Point Prices

Settlement Point Prices

Explore Settlement Point Prices by zone LZ, Hub and Basis in 1-month, 3-month, 6-month, YTD or 1-year views

Demand Response Set Up

Demand Response Set Up

In the case of an event, choose who and how notifications are distributed (email, phone, text); document past auction results and payouts.

Billing Statements

Billing Statements

Billing Summary by Total Usage (kWh), Total Bills and Average Cost per kWh; search and view billing by client account

LEARN MORE ABOUT OUR ENERGY ANALYTICS PLATFORM!

Links Energy Partners has over 75 years of combined experience in the energy and utility industry. Since 2012, our team has provided our customers with energy management solutions, like Demand Response, to maximize their potential revenue and savings.

Based in Houston, our services extend across the country including Texas, Ohio, Illinois, Pennsylvania, New Jersey, Maryland, D.C., New York, Massachusetts and California (ERCOT, PJM, NYISO, CAISO, NEISO and MISO). Call (832) 285-6797 or email us at NOC@LinksEP.com to get started on your Demand Response program.